

Viridian’s Chart of the Week previews the upcoming Q2:2024 earnings releases for MSOs that begin in the first week of August. We wanted to have an early look before the company nudging of analysts “corrects” the estimates. The table below shows consensus estimates of Q2:2024 revenues and EBITDA for 14 MSOs in order of release date. Revenues for Q1:24 and Q2:23 are presented for comparison purposes.
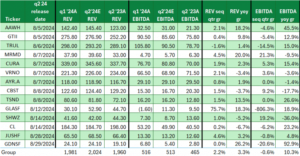
Half of the companies on the chart have projected negative sequential growth in EBITDA for Q2:24. This is surprising because Q2 is generally a seasonally stronger quarter, and in the previous three years, an average of nearly 80% of the companies on the chart have had higher EBITDA in Q2 compared to Q1.
Analysts are projecting a 10.2% y/o/y EBITDA growth for Q2 and full-year 2024 EBITDA growth of 9.8% compared to 2023. However, 1st half of 2024 results, including the Q2 estimates, are 14.2% higher than the 1st half of 2023, implying that second-half growth will only be around 6.0%. Are analysts expecting dramatic slowing, or have they just not updated their 2024 estimates?
Anecdotally, IR spokesmen for several companies have spoken of tightening consumer spending, price declines in New Jersey and other markets, and a generally competitive retail environment.
While we don’t challenge the idea of a consumer slowdown, we continue to believe sell-side analysts are being slow to adjust earnings estimates upward, and the impact of Ohio in the second half seems underappreciated.
View This Week’s Viridian Chart of the Week For a Deeper Analysis of the Upcoming Second Quarter 2024 Earnings Results
About The Viridian Cannabis Deal Tracker
Launched in January 2015, and having analyzed more than $75B in deals, the Viridian Cannabis Deal Tracker is a proprietary data service that monitors and analyzes capital raise and M&A activity in the legal Cannabis, Hemp, and Psychedelics industries. Our insights help companies, investors, lenders and acquirers make informed capital allocation decisions. Each week the Deal Tracker provides proprietary data and market intelligence on transactions, including:
– Deals by Industry Sector (Track the Flow of Capital and M&A Deals by Industry Sector)
– Deal Structure (Equity/Debt for Capital Raises, Cash/Stock/Earnout for M&A)
– Principals to the Transaction (Issuer/Investor/Lender/Acquirer)
– Key Deal Terms (Deal Size, Valuation, Pricing, Warrants, Cost of Capital)
– Deals by Location of Issuer/Buyer/Seller (Track the Flow of Deals by State and Country)
– Credit Ratings (Leverage and Liquidity Ratios)
Contact
Scott Greiper
CEO
Viridian Capital Advisors, LLC
646.330.0704
sgreiper@viridianca.com