The majority of MSO Q2: 24 earnings reports are in, and the press releases and conference calls had several repeated themes: Wholesale pricing pressure, increasing retail competition, and inflation caused consumer wallet tightening.
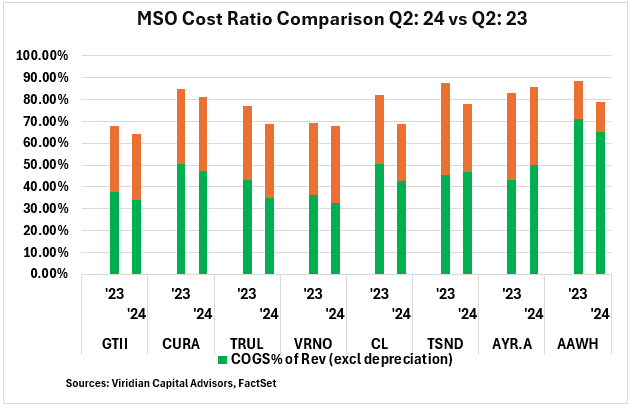
To evaluate the severity of this guidance, this week’s Viridian Chart of the Week compares the q2: 24 COGS and SG&A ratios of the top eight companies that have reported to q2: 23. We calculated COGS and SG&A, both on a cash basis, by excluding the depreciation and amortization included in the reported figures.
We find little evidence of gross margin erosion. Six of the eight companies on the chart had lower COGS ratios in q2: 24 than in q2:23. The outliers, with higher cogs, are AYR and TerrAscend.
Moreover, six of the eight companies also had lower SG&A ratios in q2: 24 than in q2: 23. We find this encouraging because SG&A ratios should improve further in the 2nd half as revenues from adult use in Ohio come on, and New York continues to build out.
While we do not challenge the notion that the consumer is hard-pressed by inflation, we remind investors that few products have shown the resilience of cannabis in challenging economic times.
The top MSOs have been improving on both gross margins and operating cost controls, and we expect them to continue to beat consensus expectations in the 2nd half of 2024.
View This Week’s Viridian Chart of the Week
About The Viridian Cannabis Deal Tracker
Launched in January 2015, and having analyzed more than $75B in deals, the Viridian Cannabis Deal Tracker is a proprietary data service that monitors and analyzes capital raise and M&A activity in the legal Cannabis, Hemp, and Psychedelics industries. Our insights help companies, investors, lenders and acquirers make informed capital allocation decisions. Each week the Deal Tracker provides proprietary data and market intelligence on transactions, including:
– Deals by Industry Sector (Track the Flow of Capital and M&A Deals by Industry Sector)
– Deal Structure (Equity/Debt for Capital Raises, Cash/Stock/Earnout for M&A)
– Principals to the Transaction (Issuer/Investor/Lender/Acquirer)
– Key Deal Terms (Deal Size, Valuation, Pricing, Warrants, Cost of Capital)
– Deals by Location of Issuer/Buyer/Seller (Track the Flow of Deals by State and Country)
– Credit Ratings (Leverage and Liquidity Ratios)
Contact
Scott Greiper
CEO
Viridian Capital Advisors, LLC
646.330.0704
sgreiper@viridianca.com