
Cannabis Pubcos With Excess Tax Liabilities Get Hammered
On Friday, June 28, 2024, Cannabis stocks were pounded by two different adverse events.
Biden’s disastrous performance in the first debate raised fears of a new Trump administration and the actions that he could take affecting cannabis. We view this as essentially a non-event. S3 is moving down the pike on auto-pilot without any active management from the president. We also doubt that Trump, if elected, would choose to interfere with the rights of States to run their cannabis industries.
The market was likely influenced more strongly by an IRS filing IR-2024-177 on June 28, which said:
- Until a final federal rule is published, the Internal Revenue Service today reminded taxpayers that marijuana remains a Schedule I controlled substance and is subject to the limitations of the Internal Revenue Code. The law with respect to the schedule or classification of marijuana has not changed. Taxpayers seeking a refund of taxes paid related to Internal Revenue Code Section 280E by filing amended returns are not entitled to a refund or payment.
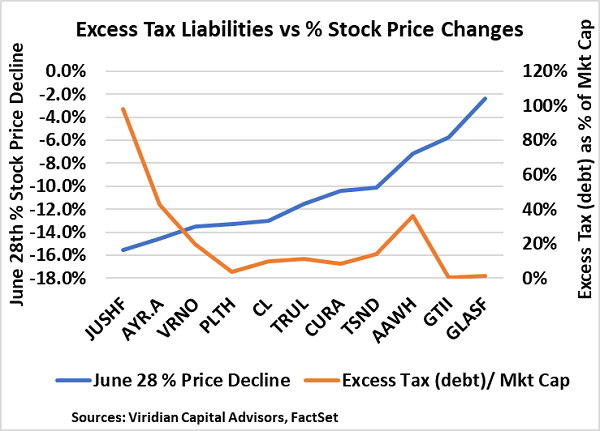
The graph looks at the Friday stock price movements of MSOs with over $100 market cap against a measure of how significant excess tax liabilities are for the company. The graph clearly shows that the companies with the highest excess tax liabilities suffered the most significant % stock declines on June 28. The biggest decliner, Jushi (JUSHF: OTCQX), down 15.6%, has excess tax liabilities, which represent approximately 98% of its market cap and 1.94x its 2024 EBITDA. Similarly, AYR (AYR.A: CSE) liabilities represent 43% of its market cap and about .74x its 2024 EBITDA.
Conversely, on the right side of the graph, Green Thumb (GTII: CSE) and Glass House Brands (GLASF: OTCQX) have virtually no excess taxes and also the smallest percentage declines in their stocks.
Investors should remain vigilant in analyzing the balance sheets of cannabis companies. Significant tax liabilities that should be considered debt reside on several MSO balance sheets. The IRS filing is fair notice that these liabilities are not just going away.
The Viridian Capital Chart of the Week highlights key investment, valuation and M&A trends taken from the Viridian Cannabis Deal Tracker.
Launched in January 2015, and having analyzed more than $75B in deals, the Viridian Cannabis Deal Tracker is a proprietary data service that monitors and analyzes capital raise and M&A activity in the legal cannabis, Hemp, and psychedelics industries. Each week the Deal Tracker provides proprietary data and market intelligence on transactions, including:
- Deals by Industry Sector (To Track the Flow of Capital and M&A Deals by One of 12 Sectors – from Cultivation to Brands to Software)
- Deal Structure (Equity/Debt for Capital Raises, Cash/Stock/Earnout for M&A)
- Principals to the Transaction (Issuer/Investor/Lender/Acquirer)
- Key Deal Terms (Deal Size, Valuation, Pricing, Warrants, Cost of Capital)
- Deals by Location of Issuer/Buyer/Seller (To Track the Flow of Capital and M&A Deals by State and Country)
Credit Ratings (Leverage and Liquidity Ratios)