

This Week’s Viridian Sector Tracker compares YTD capital raise activity this year vs. the same period in 2023, for all of the industry sectors we’ve been tracking for more than nine years.
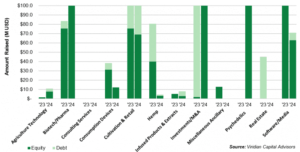
There’s been a consistent rotation of capital in and out of these individual sectors over time. Our data provides insight as to how to interpret and capitalize on these trends.
View This Week’s Viridian Sector Deal Tracker For a Deeper Dive Into M&A and Capital Raise Transactions by Industry Sector
Wondering if Now is the Time to Sell Your Profitable State Licensed Company? Contact Us We’ll Give You the Facts About How Buyers Are Paying in the Current Market
About The Viridian Cannabis Deal Tracker
Launched in January 2015, and having analyzed more than $75B in deals, the Viridian Cannabis Deal Tracker is a proprietary data service that monitors and analyzes capital raise and M&A activity in the legal Cannabis, Hemp, and Psychedelics industries. Our insights help companies, investors, lenders and acquirers make informed capital allocation decisions. Each week the Deal Tracker provides proprietary data and market intelligence on transactions, including:
– Deals by Industry Sector (Track the Flow of Capital and M&A Deals by Industry Sector)
– Deal Structure (Equity/Debt for Capital Raises, Cash/Stock/Earnout for M&A)
– Principals to the Transaction (Issuer/Investor/Lender/Acquirer)
– Key Deal Terms (Deal Size, Valuation, Pricing, Warrants, Cost of Capital)
– Deals by Location of Issuer/Buyer/Seller (Track the Flow of Deals by State and Country)
– Credit Ratings (Leverage and Liquidity Ratios)