

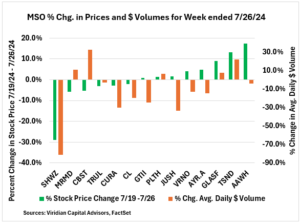
The Viridian Chart of the Week looks at the percentage changes in stock prices and average daily dollar volume for large MSOs from the week ended 7/19/24 to the week ended 7/26/24.
The green bars (on the left axis depict the percent price change from 7/19/24 to 7/26/24). The graph is arranged in increasing order of percentage price changes. The orange bars (measured on the right axis) show the percentage change in average weekly dollar volume for the week ended 7/26/24 compared to the week ended 7/19/24.
The week had two major news stories: Joe Biden’s exit from the Presidential race and the end of the DEA comment period on rescheduling. Most analysts, ourselves included, believed that both of these events were solidly positive for cannabis. Harris is thought to have a much better chance of beating Trump and is also considered to be a staunch cannabis advocate.
Similarly, the comment period for rescheduling ended, and reportedly, over 90% of the comments were pro-rescheduling. The industry worked its way into another Twitter firestorm over how rescheduling was on its way any day now.
Given these events, it seemed reasonable to expect a significant uptick in trading volume, propelling prices sharply higher. But the average price increase percentage for the group was 0.2%, and the aggregate average daily trading volume was down nearly 14%. Six of the 14 companies had price declines, and 9 of the 14 had lower average dollar volume.
What went wrong? Cannabis investors have been burned too many times and are unwilling to bet on speculation. Will Harris be positive for cannabis? Who knows? It depends a lot on her winning, right? Similarly, no news is not good news when it comes to cannabis regulatory/legislative events. We’ll believe it when we see it.
Still, despite the lackluster reception, we continue to be bullish. No other sector offers the catalyst-driven capital appreciation potential that cannabis does. Just don’t expect this market to behave like you expect it to!
View This Week’s Viridian Chart of the Week
About The Viridian Cannabis Deal Tracker
Launched in January 2015, and having analyzed more than $75B in deals, the Viridian Cannabis Deal Tracker is a proprietary data service that monitors and analyzes capital raise and M&A activity in the legal Cannabis, Hemp, and Psychedelics industries. Our insights help companies, investors, lenders and acquirers make informed capital allocation decisions. Each week the Deal Tracker provides proprietary data and market intelligence on transactions, including:
– Deals by Industry Sector (Track the Flow of Capital and M&A Deals by Industry Sector)
– Deal Structure (Equity/Debt for Capital Raises, Cash/Stock/Earnout for M&A)
– Principals to the Transaction (Issuer/Investor/Lender/Acquirer)
– Key Deal Terms (Deal Size, Valuation, Pricing, Warrants, Cost of Capital)
– Deals by Location of Issuer/Buyer/Seller (Track the Flow of Deals by State and Country)
– Credit Ratings (Leverage and Liquidity Ratios)
Contact
Scott Greiper
CEO
Viridian Capital Advisors, LLC
646.330.0704
sgreiper@viridianca.com